532: quantum of sollazzo
#532: quantum of sollazzo – 29 August 2023
The data newsletter by @puntofisso.

Hello, regular readers and welcome new ones :) This is Quantum of Sollazzo, the newsletter about all things data. I am Giuseppe Sollazzo, or @puntofisso. I've been sending this newsletter since 2012 to be a summary of all the articles with or about data that captured my attention over the previous week. The newsletter is and will always (well, for as long as I can keep going!) be free, but you're welcome to become a friend via the links below.
The most clicked link last week was... my screenprinting toot. Really?!
This issue reaches you on the first day in my new role. Feeling a mixture of excitement and terror as I write that :-)
'till next week,
Giuseppe @puntofisso
✨ Topical
Mapping Diversity - updates
I've covered the excellent Mapping Diversity project before, a look at how street names are chosen. The team behind it has now [released the full dataset](https://www.europeandatajournalism.eu/cp_data_news/mapping-diversity-full-dataset-release/ used in the analysis.

Military recruitment is down. Why don’t young Americans want to join?
"A diminishing pool of Americans are eligible to join the Army, Navy, or Air Force. An even smaller pool want to."
A chart of why young people don't want to join, you'll soon realise that it would be great to see the same data split by gender.

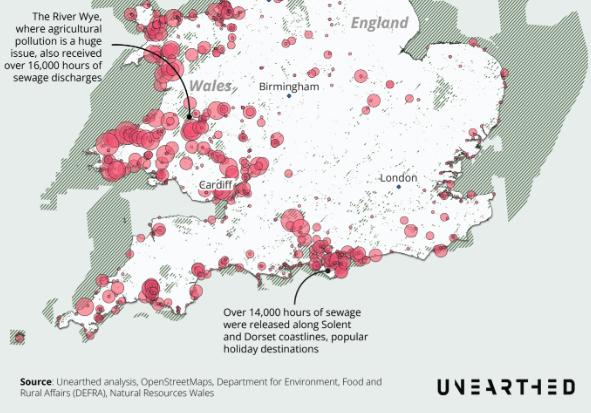
Over 300,000 hours of sewage spills hit England and Wales’ most protected habitats last year
"Using mapping analysis, Unearthed identified almost 1,200 sewage overflows that discharged in or close to internationally important habitats last year, all of which are supposed to be protected by formal conservation regimes."
Interestingly, all the data is shared, alongside the methodology.
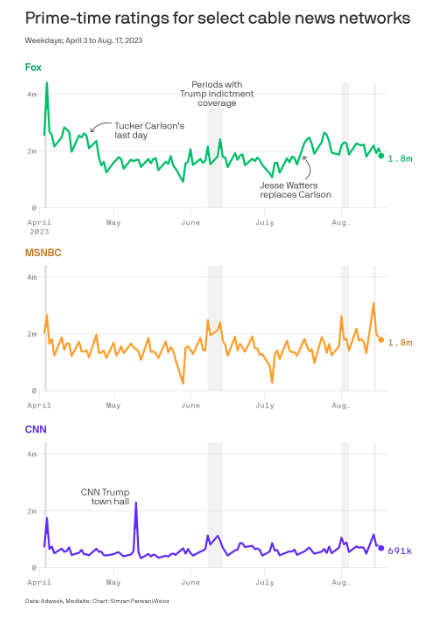
📺 1 big thing: MSNBC's Trump bump
"MSNBC has seen a huge boost in prime-time ratings this summer, thanks in large part to its coverage of the slew of indictments against former President Donald Trump."
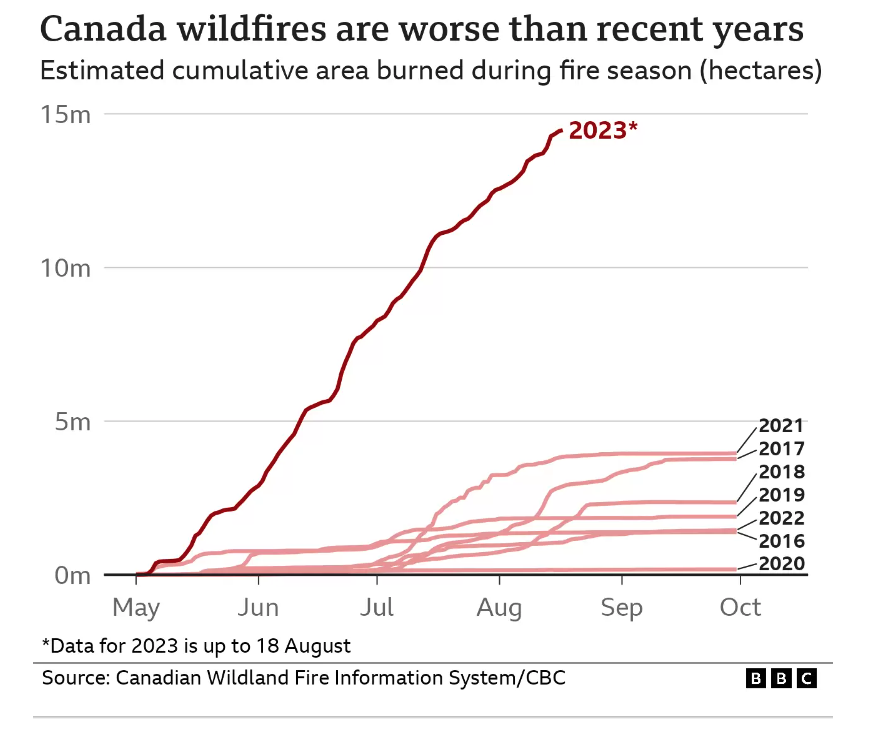
The numbers behind Canada’s worst wildfires season
"This has been - by some distance - the worst wildfire season in Canada's history."
With similar extremes happening around the world, the climate anxiety is rising.
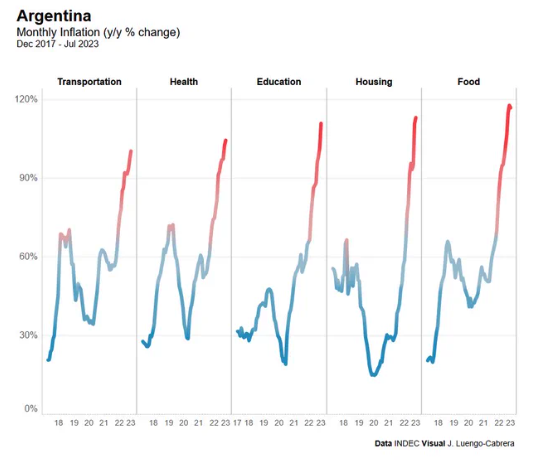
Argentina: monthly inflation
By José Luengo-Cabrera from Twitter.
🛠️📖 Tools & Tutorials
Handle big, ugly and bad CSV files
"Tips & tricks , inspired by DuckDB, Parquet files and OpenCoesione". This is an automated tranlation of this amazing article in Italian by data guru Andrea Borruso. It covers DuckDB, Miller, and VisiData.

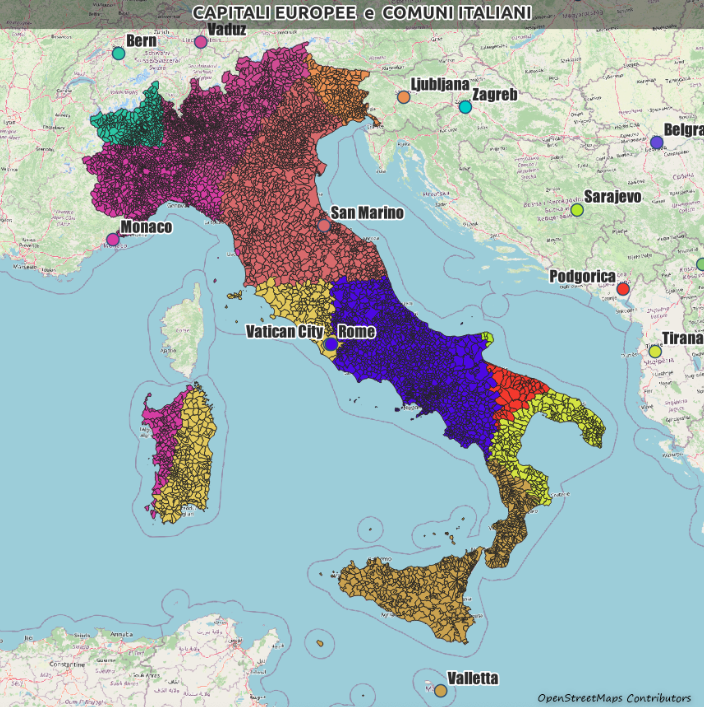
closest_European cities
You will remember that last week I linked to my own step-by-step how to for a map of distances in QGIS (it's here in case you missed it). Totò Fiandaca has greatly improved it and made it dynamic, using the shapefile of all mayoralties, showing how to assign each mayoralty. It's in Italian and here is automatically translated into English, but the images should be relatively self-explanatory.
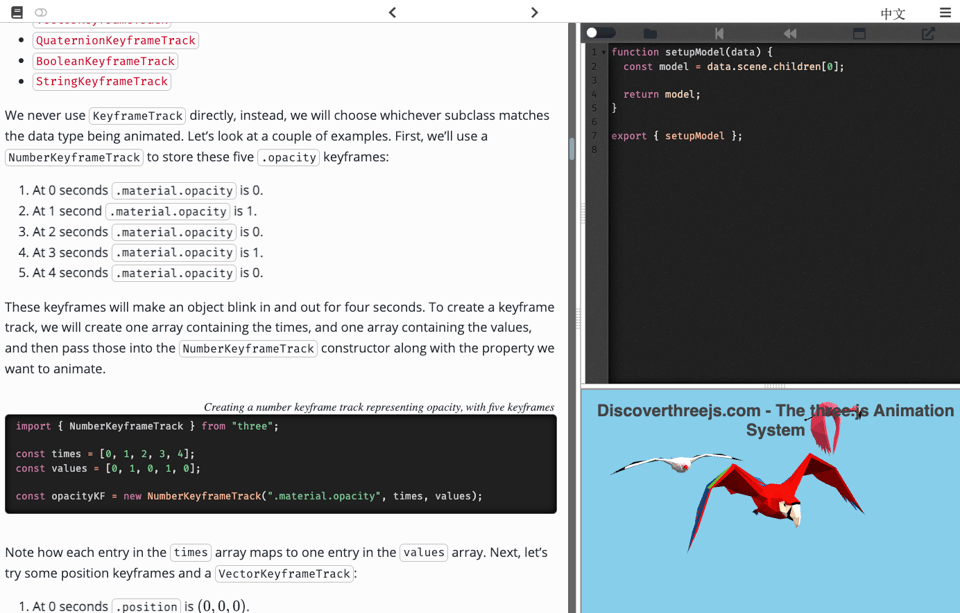
Discover three.js
This is an online book which says it is "a complete introduction to the web as a platform for 3D graphics using the three.js WebGL library, from one of the core three.js developers."
By developer Lewy Blue, it looks pretty comprehensive and interactive.
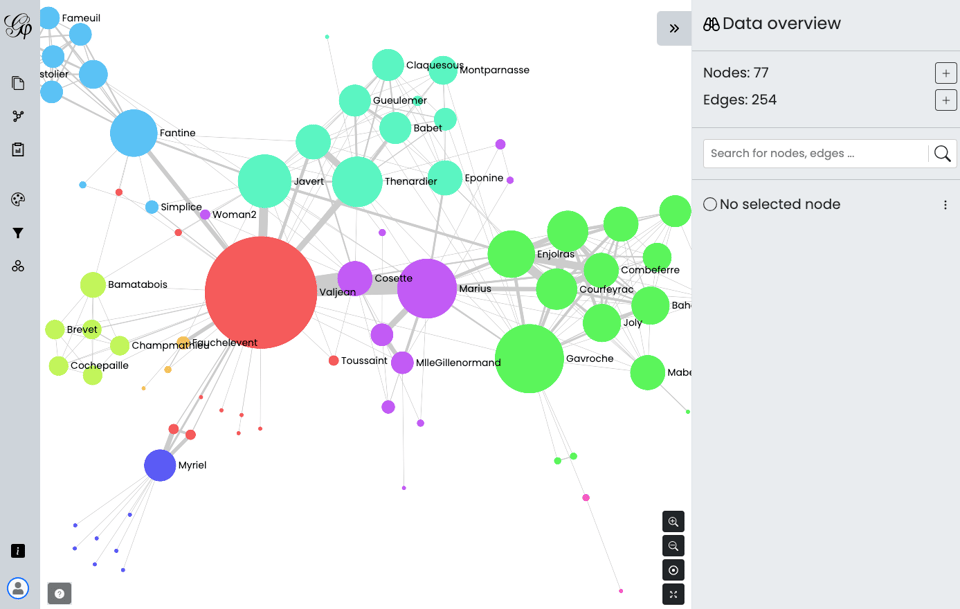
Gephi Lite
The popular network analysis tool has launched a web version called Gephi Lite.
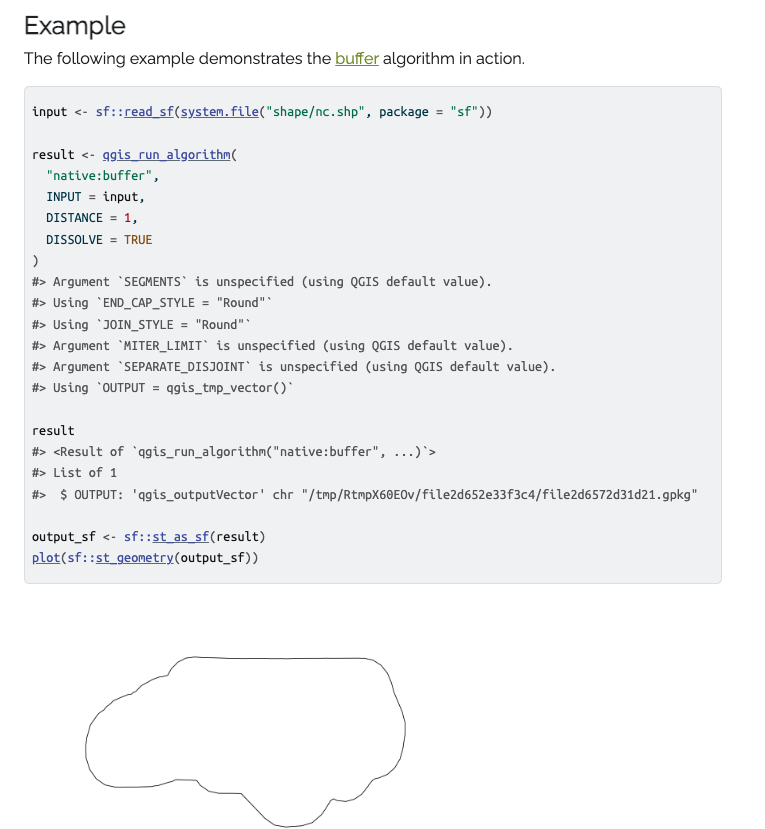
qgisprocess
You can now use QGIS geoprocessing algorithms in the R programming language, thanks to the CRAN release of the qgisprocess library. As Robin Lovelace notes: "You can now call any of ~1000 geo algorithms in QGIS + plugins from #rstats. "
vidcutter
"A modern yet simple multi-platform video cutter and joiner."
How do domain-specific chatbots work?
"An Overview of Retrieval Augmented Generation (RAG). Demystifying and deconstructing Q&A bots that work over your data."
|
Before you go... DO YOU LIKE QUANTUM OF SOLLAZZO? → BECOME A SUPPORTER! :) If you enjoy this newsletter, you can support it by becoming a GitHub Sponsor. Or you can Buy Me a Coffee. I'll send you an Open Data Rottweiler sticker. You're receiving this email because you subscribed to Quantum of Sollazzo, a weekly newsletter covering all things data, written by Giuseppe Sollazzo (@puntofisso). If you have a product or service to promote and want to support this newsletter, you can sponsor an issue. |
🤯 Data thinking
Is probability frequentist or Bayesian?
"Spoiler alert: it's neither."
Is the placebo powerless?
An interesting paper is circulating about the placebo effect. The full paper is here. It's an old one, but it's triggering some debate. A good point about how to test for placebo is in this tweet.
📈Dataviz, Data Analysis, & Interactive
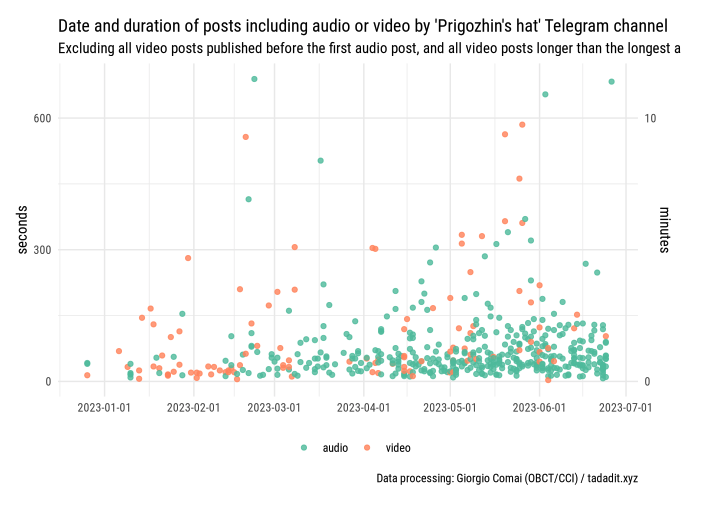
FROM THE ‘BATTLE OF BAKHMUT’ TO THE ‘MARCH OF JUSTICE’: PRIGOZHIN’S AUDIO FILES, TRANSCRIBED
"Prigozhin’s press service actively responds via Telegram to questions asked by journalists. Questions are mostly posted as screenshots, responses are mostly posted as audio messages, other posts include video. How do we turn these into something that can be searched and analysed?"
By Osservatorio Balcani Caucaso's Giorgio Comai.
Historical Meteo Graphs
This website does exactly what it says on the tin, and it seems to be doing it really well. It uses data from open-meteo. The source code is on GitHub (albeit with a slightly restrictive CC BY-SA-NC).

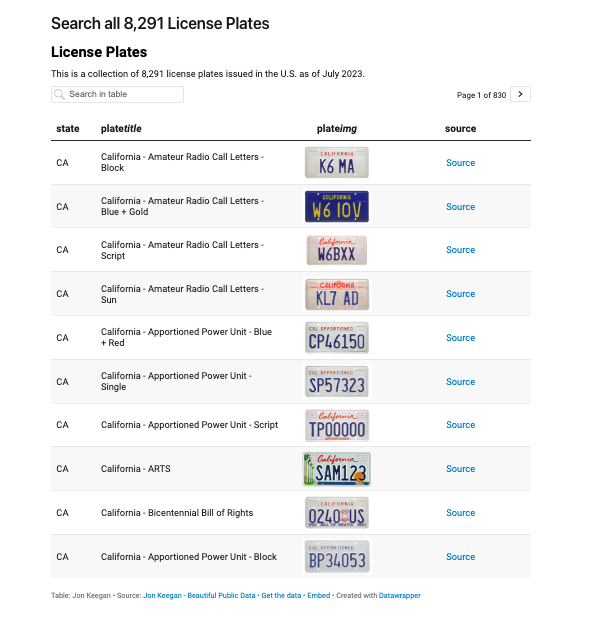
All of the 8,291 License Plates in America
"States now offer a vast menu of personalized plate options for a dizzying array of organizations, professions, sports teams, causes and other groups."
Jon Keegan's Beautiful Public Data captures this very, very American dataset.
Maryland tops the chart with almost twice as many design as the next state, but... California has a ham radio callsign category... I'm sold!
The wait between major video game sequels is getting longer
"Big video game sequels are taking more years than ever to make it to players", says Axios.

The “new normal”: Charts on how we at Datawrapper slowly return to the office
Datawrapper's Lisa Charlotte Muth shares charts on how the company has returned to the office post-COVID.

The Matrix Arcade
"A Visual Explorable of Matrix Transformations."

Infinity
Dea Bankova has created this website to explore the mathematical concept of infinity using dataviz.

quantum of sollazzo is also supported by Andy Redwood’s proofreading – if you need high-quality copy editing or proofreading, check out Proof Red. Oh, and he also makes motion graphics animations about climate change.

Supporters*
Alex Trouteaud
casperdcl / iterative.ai
Naomi Penfold
[*] this is for all $5+/months Github sponsors. If you are one of those and don't appear here, please e-mail me