513: quantum of sollazzo
#513: quantum of sollazzo – 11 April 2023
The data newsletter by @puntofisso.

Hello, regular readers and welcome new ones :) This is Quantum of Sollazzo, the newsletter about all things data. I am Giuseppe Sollazzo, or @puntofisso. I've been sending this newsletter since 2012 to be a summary of all the articles with or about data that captured my attention over the previous week. The newsletter is and will always (well, for as long as I can keep going!) be free, but you're welcome to become a friend via the links below.
The most clicked link last week was ProPublica's analysis of Ebola outbreak risk.
Next week, I'll be in Buenos Aires, where I'll be one of the keynote speakers at csv,conf,v7 (yes, it's really called like that, isn't it beautiful?). Some of the talks on the agenda look absolutely outstanding. Tune in, it will all be available remotely. Forgive me if I skip an issue, my brain might be entirely overwhelmed :-)
'till next week,
Giuseppe @puntofisso
|
Become a Friend of Quantum of Sollazzo from $1/month → If you enjoy this newsletter, you can support it by becoming a GitHub Sponsor. Or you can Buy Me a Coffee. I'll send you an Open Data Rottweiler sticker. You're receiving this email because you subscribed to Quantum of Sollazzo, a weekly newsletter covering all things data, written by Giuseppe Sollazzo (@puntofisso). If you have a product or service to promote and want to support this newsletter, you can sponsor an issue. |
✨ Topical
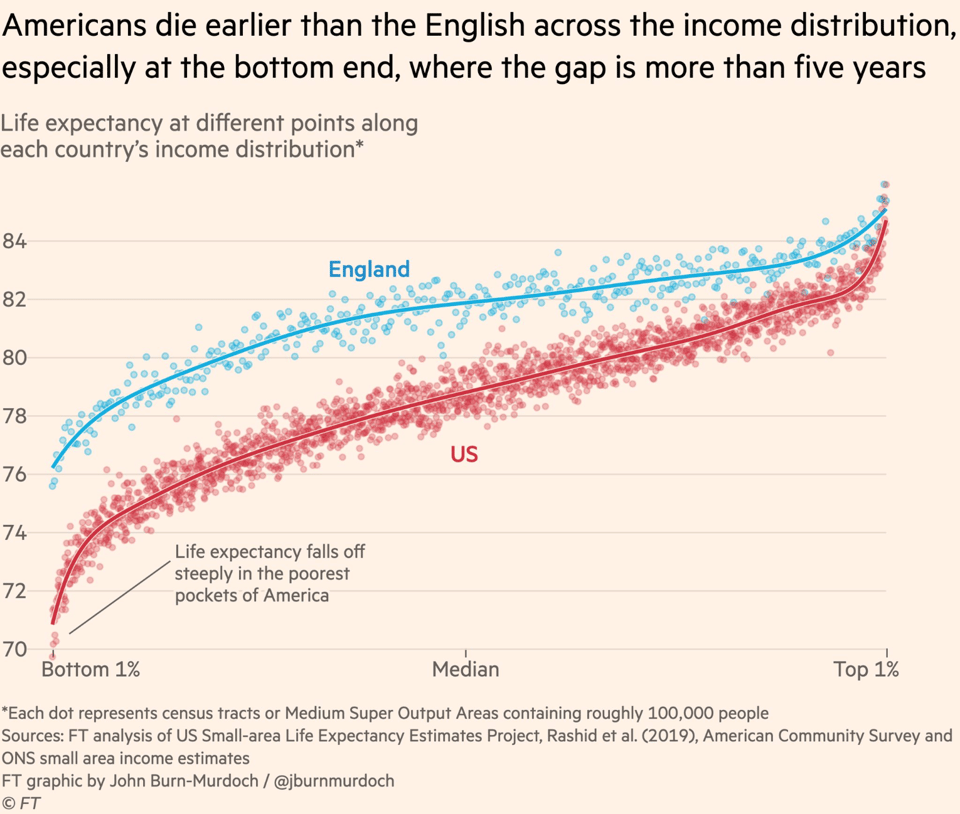
At every point on the income distribution, Americans live shorter lives than the English
Another great John Murdoch data analysis and visualization for the Financial Times. Here's a Twitter thread summary, too.
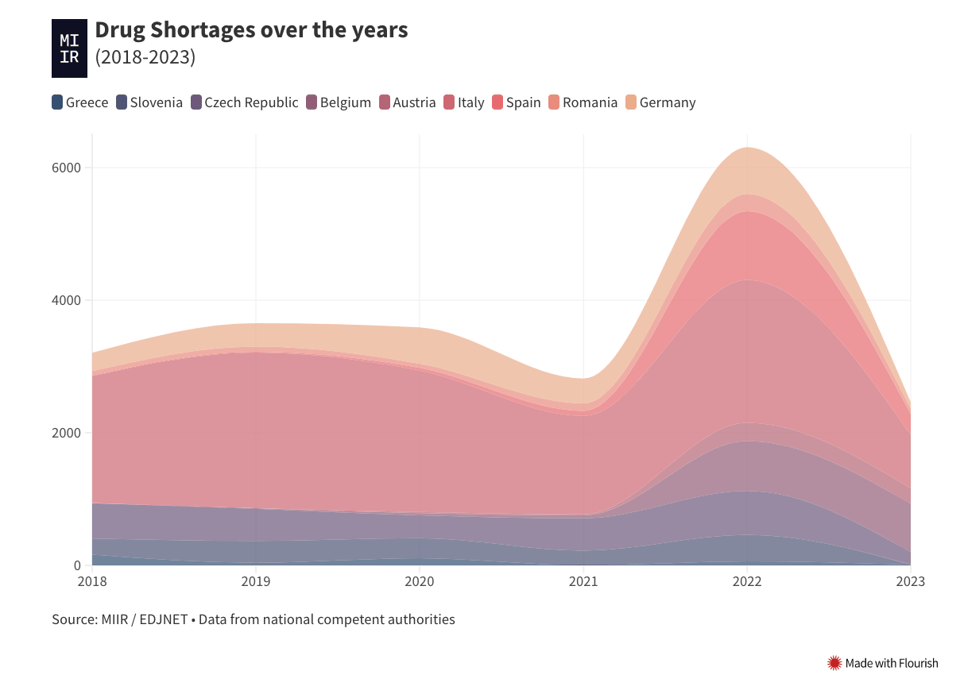
Why Europe is running out of medicines, again
"In the past 20 years drug shortages have surged in Europe. Governments have recently used the war in Ukraine and the energy crisis to cover up the real – far more structural – reasons behind them."
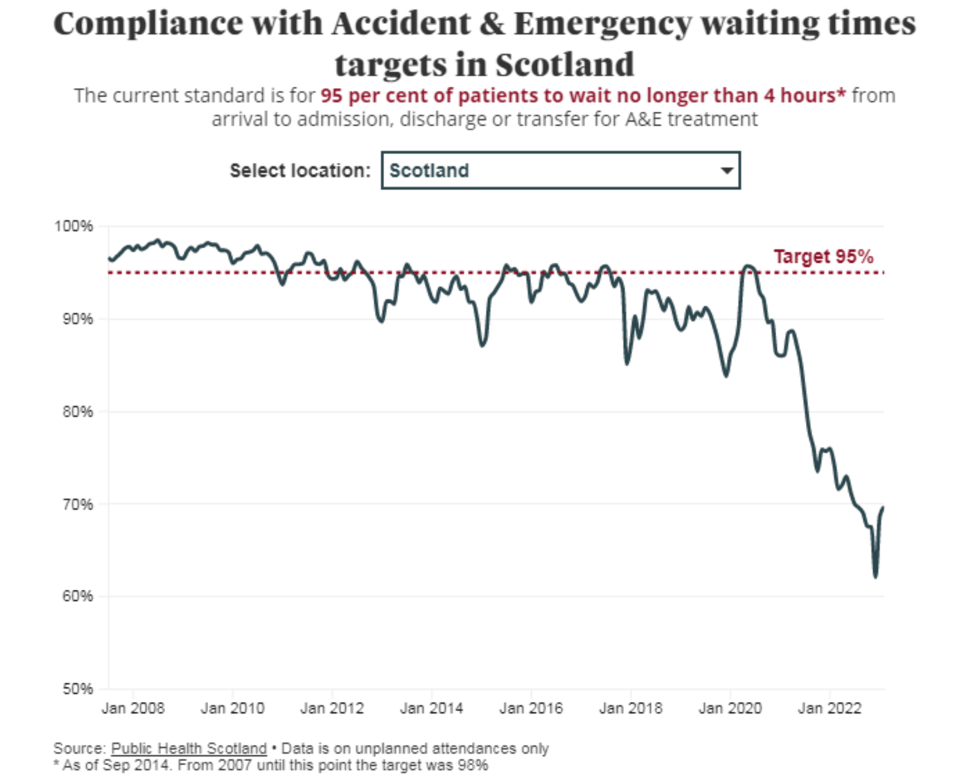
The Courier's NHS Scotland trackers and data
Fresh data is available here, as explained by Lesley-Ann Kelly in this Twitter thread.
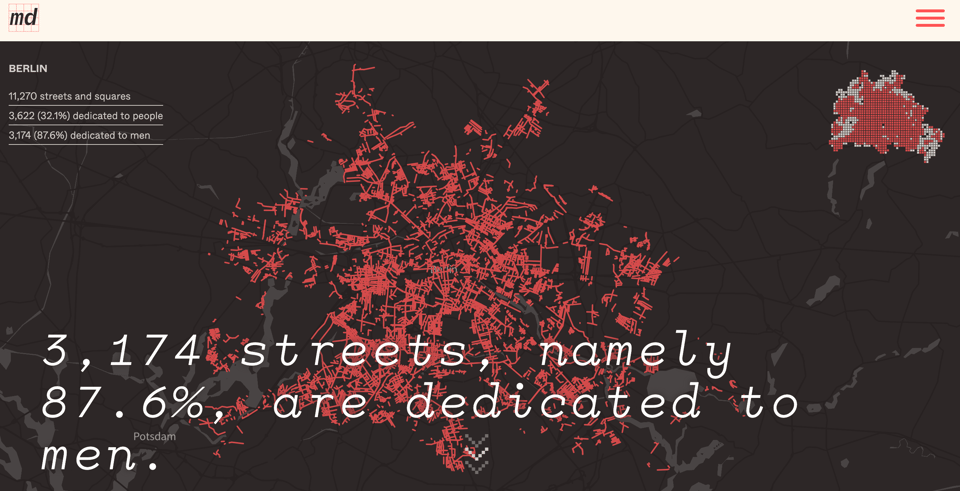
Mapping Diversity
"Mapping Diversity is a platform for discovering key facts about diversity and representation in street names across Europe, and to spark a debate about who is missing from our urban spaces."
I covered this before, but they've now extended it to the whole of Europe.
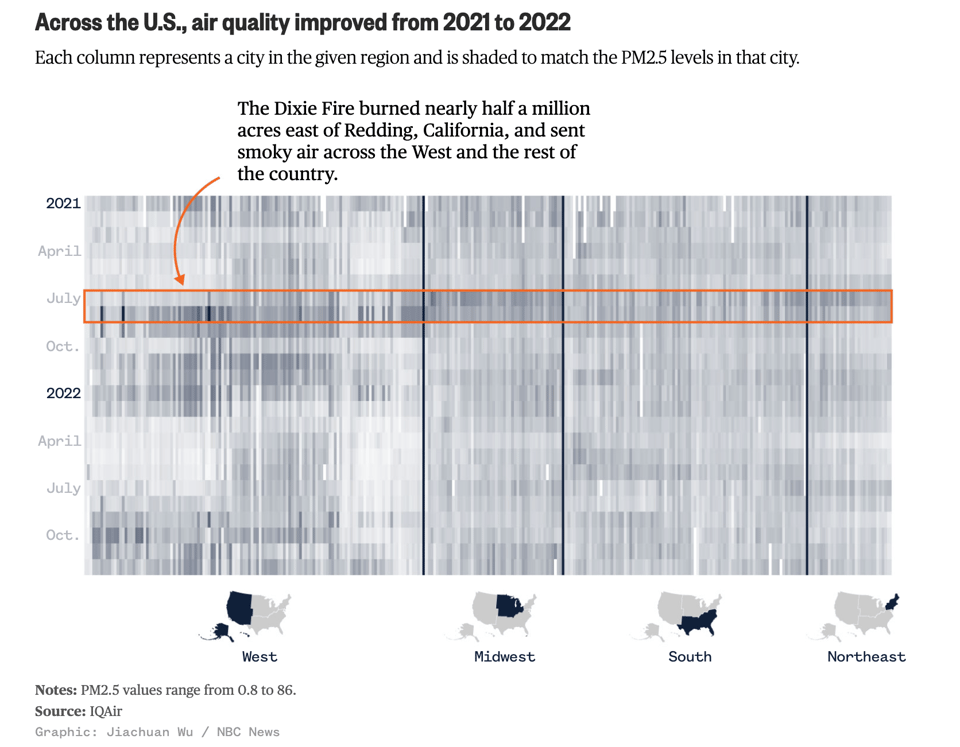
Interactive: U.S. air quality improved in 2022. See how your city fared.
"Fewer wildfires led to better air across the country, particularly in the West."
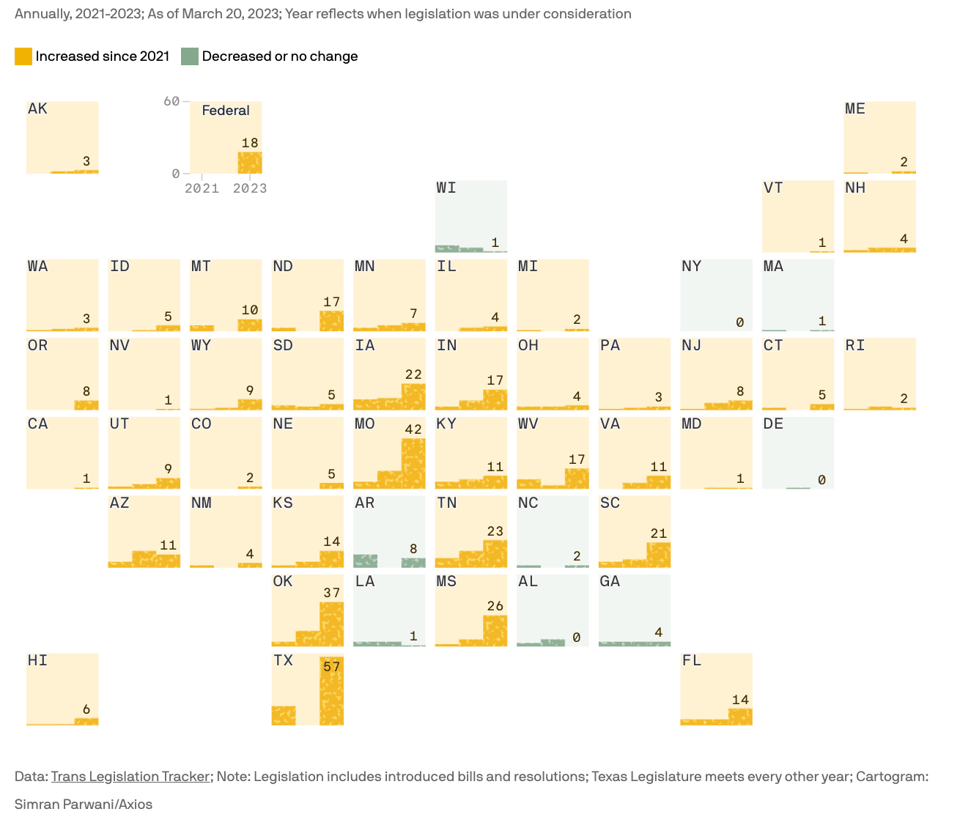
The forces behind anti-trans bills across the U.S.
"Anti-trans legislation introduced, by state."
🛠️📖 Tools & Tutorials
Finding Undocumented APIs
"Most APIs are undocumented and hidden in plain sight. Being able to find these APIs can provide a rich, reliable, and scalable method of building your own datasets."
Don't do this at home etc etc. For investigative journalists.
Neural Networks: Zero to Hero
"A course by Andrej Karpathy on building neural networks, from scratch, in code. We start with the basics of backpropagation and build up to modern deep neural networks, like GPT. "
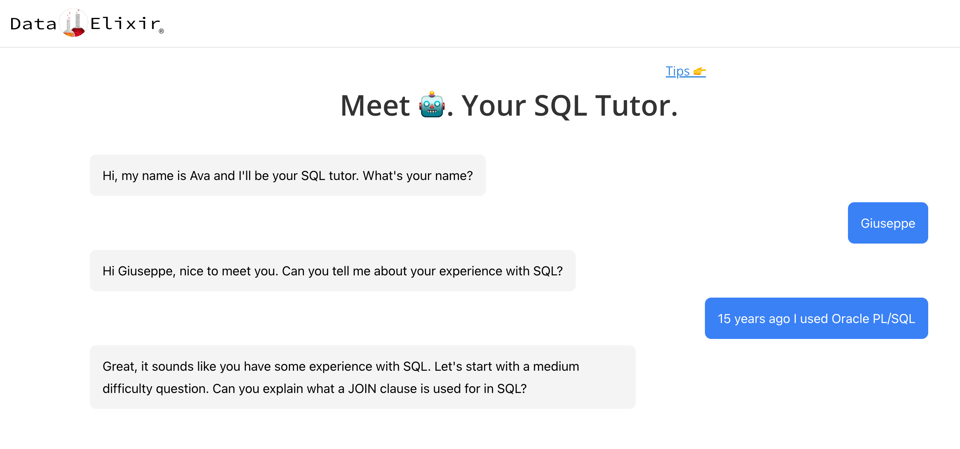
SQL Tutor
Data Elixir has launched a (seemingly conversational AI powered) SQL Tutor.
AI-enhanced development makes me more ambitious with my projects
Simon Willison, the creator of Datassette, Django, and Lanyrd: "In the past I’ve had plenty of ideas for projects which I’ve ruled out because they would take a day—or days—of work to get to a point where they’re useful. I have enough other stuff to build already! But if ChatGPT can drop that down to an hour or less, those projects can suddenly become viable. Which means I’m building all sorts of weird and interesting little things that previously I wouldn’t have invested the time in."
How to use AI to do practical stuff: A new guide
"People often ask me how to use AI. Here's an overview with lots of links."
A bit more mundane and practical than Simon Willison's take, but it will give you a few ideas on what's possible today with AI tools.
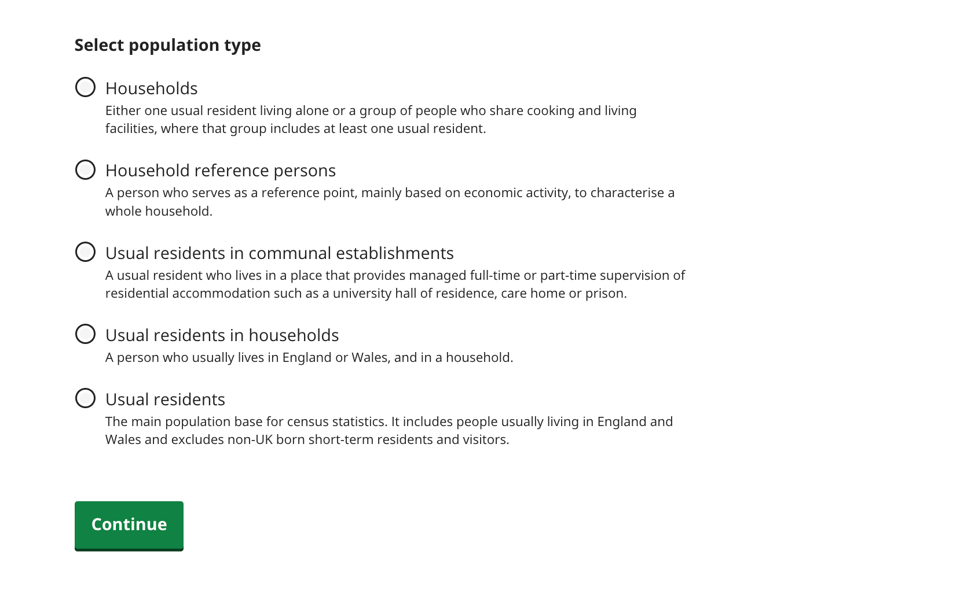
Create a custom (UK Census) dataset
"We group Census 2021 data together based on who or what the information is about, for example, people or households. We make population types from these groups or subsets of them."
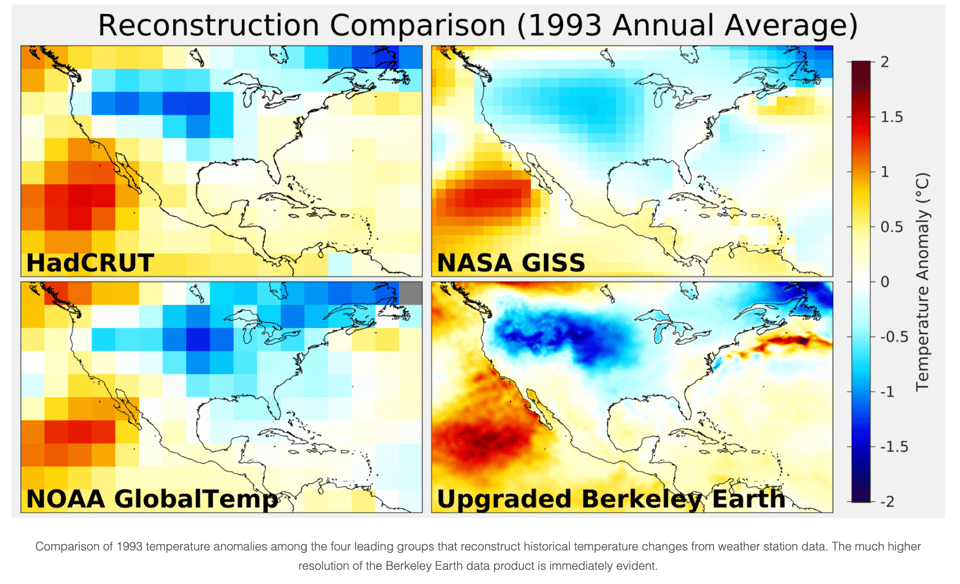
Introducing the Berkeley Earth High-Resolution Dataset
"Berkeley Earth, a non-profit research organization, is releasing a beta version of its new High-Resolution Temperature Dataset."
It's AI-powered but peer-reviewed.
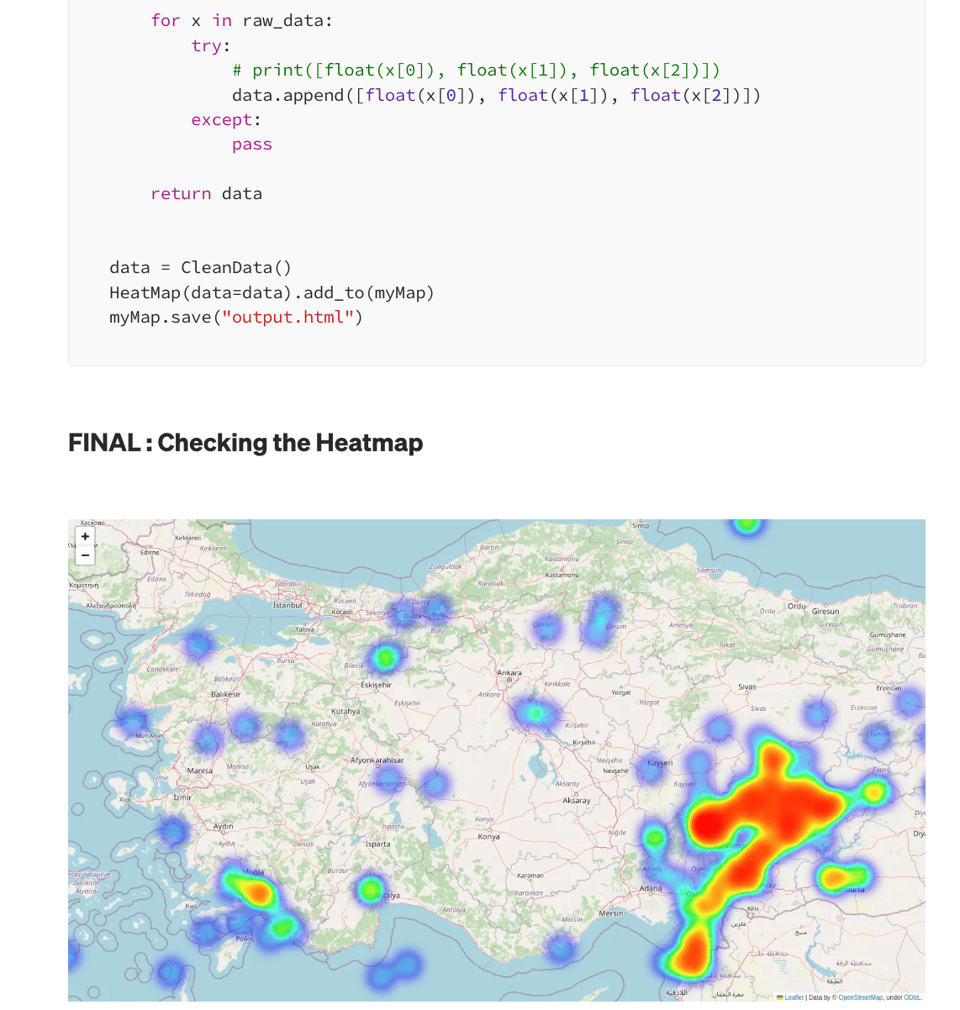
EARTHQUAKE HEATMAP PROJECT
"A Python Project using Folium Library".
From data to code to map.
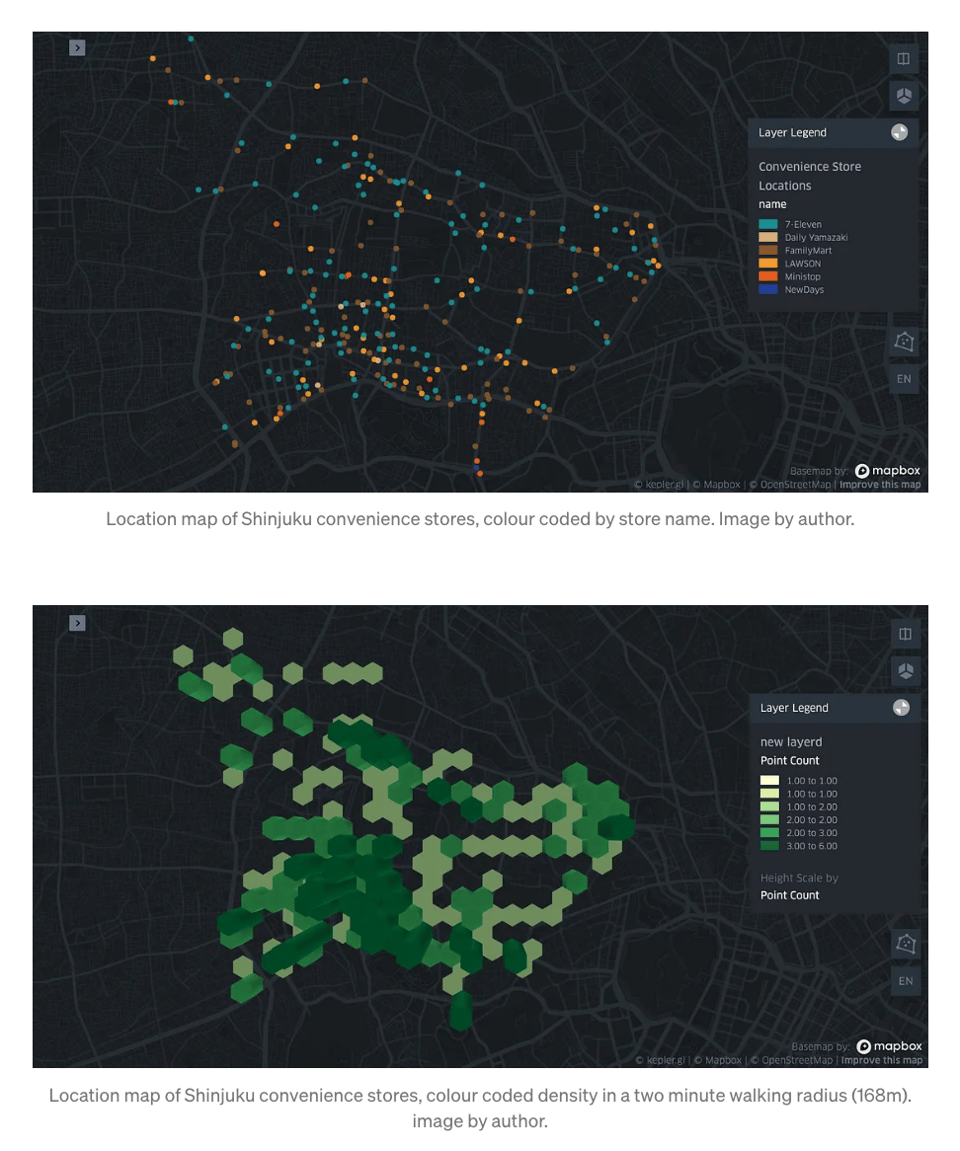
Finding Patterns in Convenience Store Locations with Geospatial Association Rule Mining
"Understanding spatial trends in the location of Tokyo convenience stores" and asking the question: "could there be any relationships between which chains of convenience stores are found near each other?"
🤯 Data thinking
The Data Delusion
"We’ve uploaded everything anyone has ever known onto a worldwide network of machines. What if it doesn’t have all the answers?", asks Jill Lepore on The New Yorker.
MLOps is Mostly Data Engineering
"TL;DR MLOps emerged as a new category of tools for managing data infrastructure, specifically for ML use cases with the main assumption being that ML has unique needs. After a few years and with the hype gone, it has become apparent that MLOps overlap more with Data Engineering than most people believed. Let’s see why and what that means for the MLOps ecosystem."
📈Dataviz, Data Analysis, & Interactive
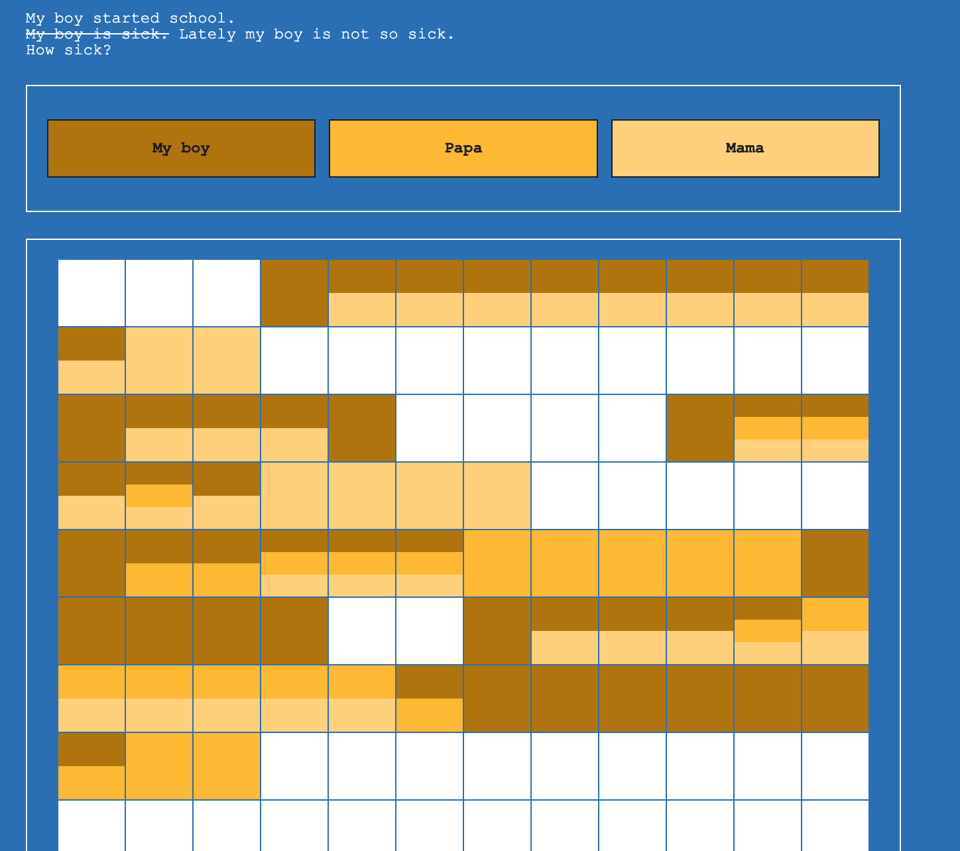
I Visualized My One-Year-Old’s Relentless Daycare Bugs and It Calmed Me Down
The story behind the My Boy Is Sick dataviz.
(via Donata Columbro's newsletter)
Gource
An animated visualization of GitHub repositories.
"Software projects are displayed by Gource as an animated tree with the root directory of the project at its centre. Directories appear as branches with files as leaves. Developers can be seen working on the tree at the times they contributed to the project."

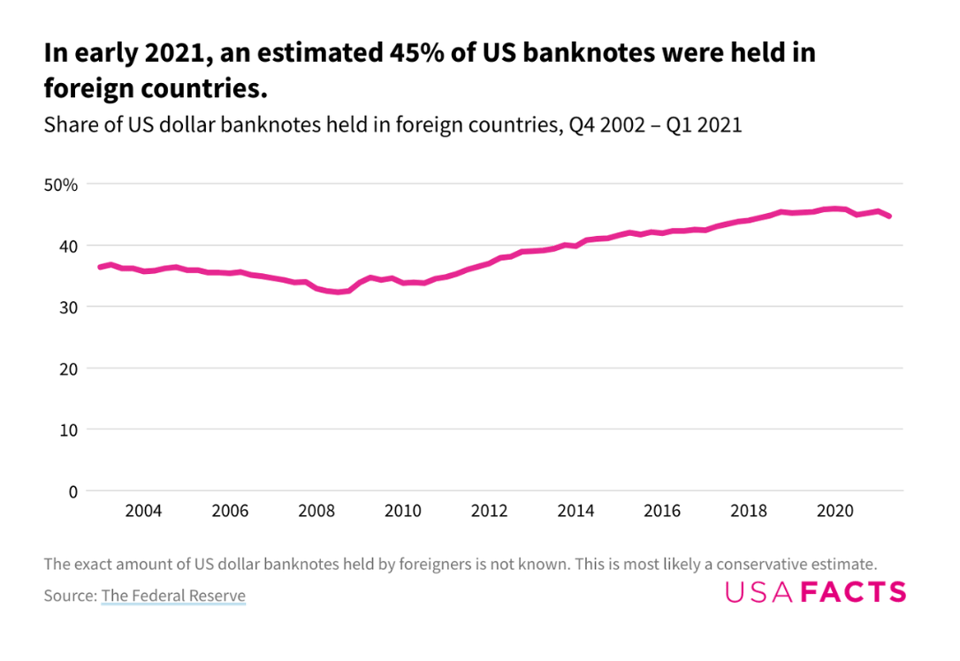
What makes the US dollar so strong?
"Most countries worldwide rely on the US dollar to support their economy."
It includes the mind-boggling chart below.
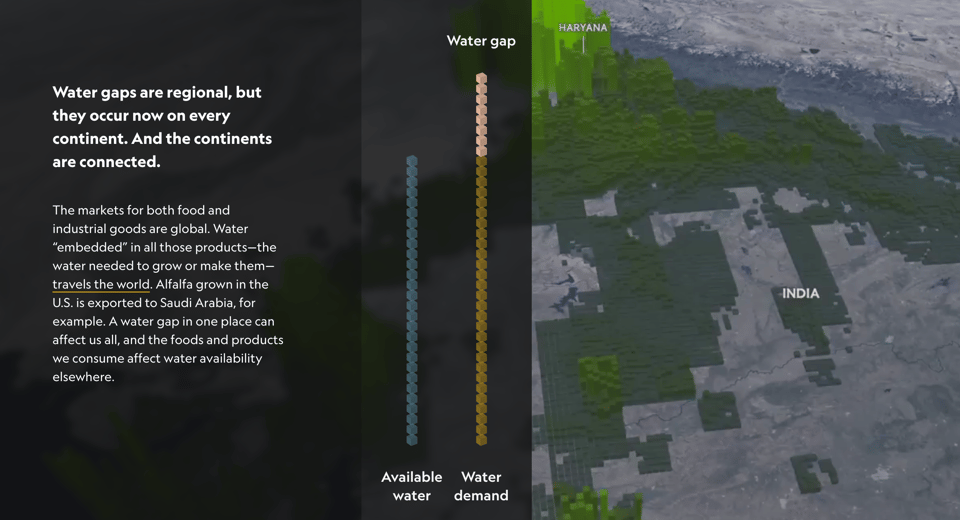
Mind the water gap
The National Geographic has been "Mapping the world’s water shortages"
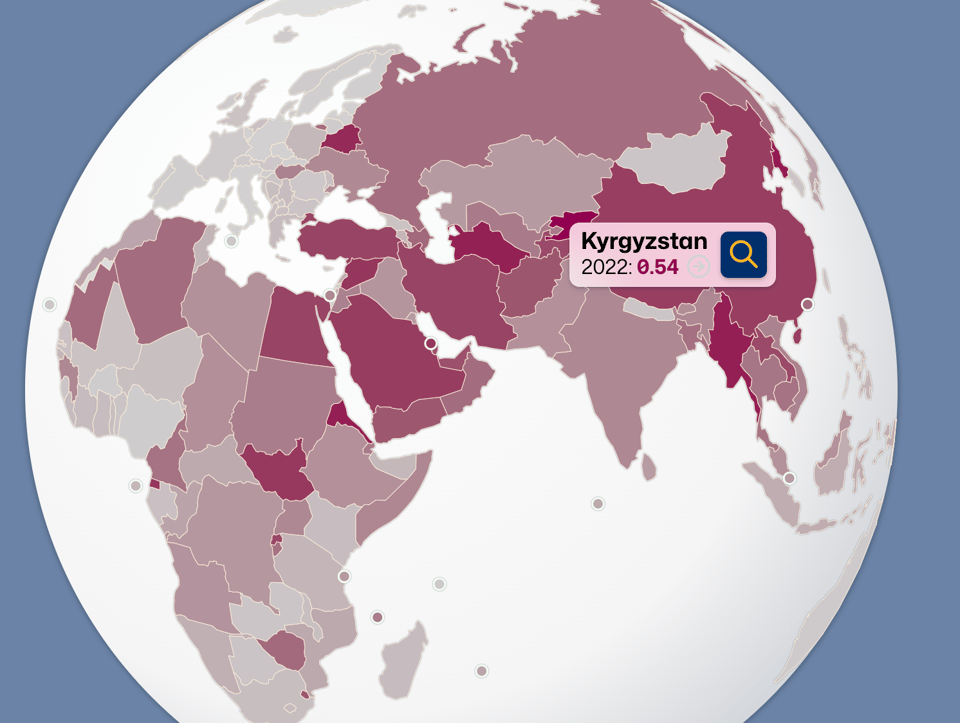
Academic Freedom Index
"The Academic Freedom Index (AFI) assesses de facto levels of academic freedom across the world. It is a unique approach to conceptualizing and measuring academic freedom and a collaborative effort between researchers at Friedrich-Alexander-Universität Erlangen-Nürnberg (FAU), and the V-Dem Institute."
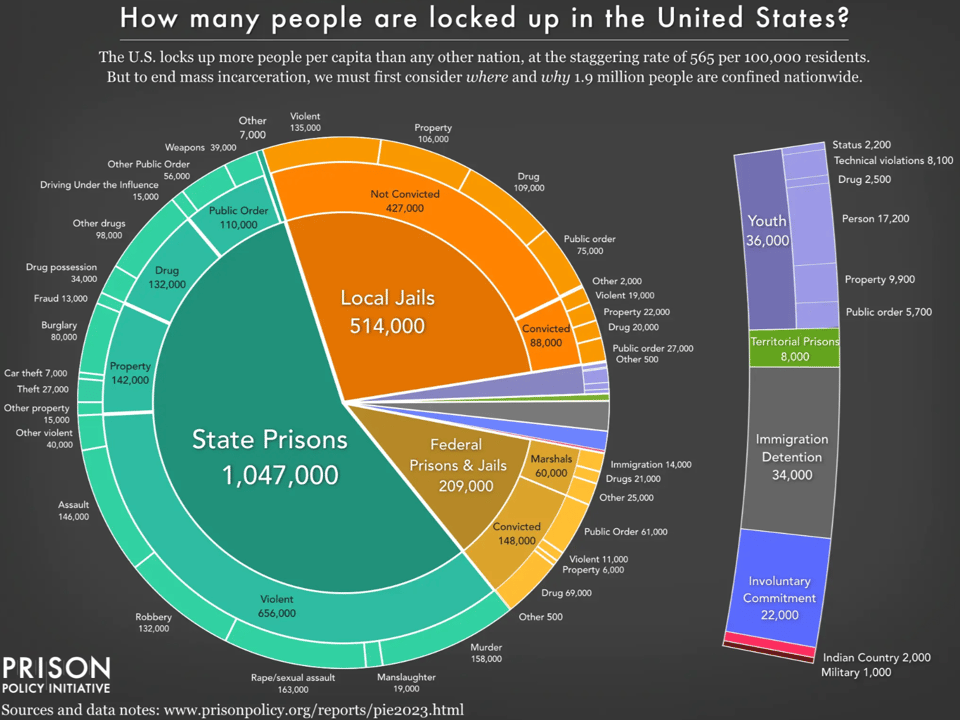
Mass Incarceration: The Whole Pie 2023
A look at data about prisons in the US.
🤖 AI
I’m an ER doctor: Here’s what I found when I asked ChatGPT to diagnose my patients
As he notes, it gives some disconcerting answers.
quantum of sollazzo is supported by ProofRed's excellent proofreading. If you need high-quality copy editing or proofreading, head to http://proofred.co.uk. Oh, they also make really good explainer videos.

Supporters* casperdcl and iterative.ai Jeff Wilson Fay Simcock Naomi Penfold
[*] this is for all $5+/months Github sponsors. If you are one of those and don't appear here, please e-mail me