484: quantum of sollazzo
#484: quantum of sollazzo – 6 September 2022
The data newsletter by @puntofisso.

Hello, regular readers and welcome new ones :) This is Quantum of Sollazzo, the newsletter about all things data. I am Giuseppe Sollazzo, or @puntofisso. I've been sending this newsletter since 2012 to be a summary of all the articles with or about data that captured my attention over the previous week. The newsletter is and will always (well, for as long as I can keep going!) be free, but you're welcome to become a friend via the links below.
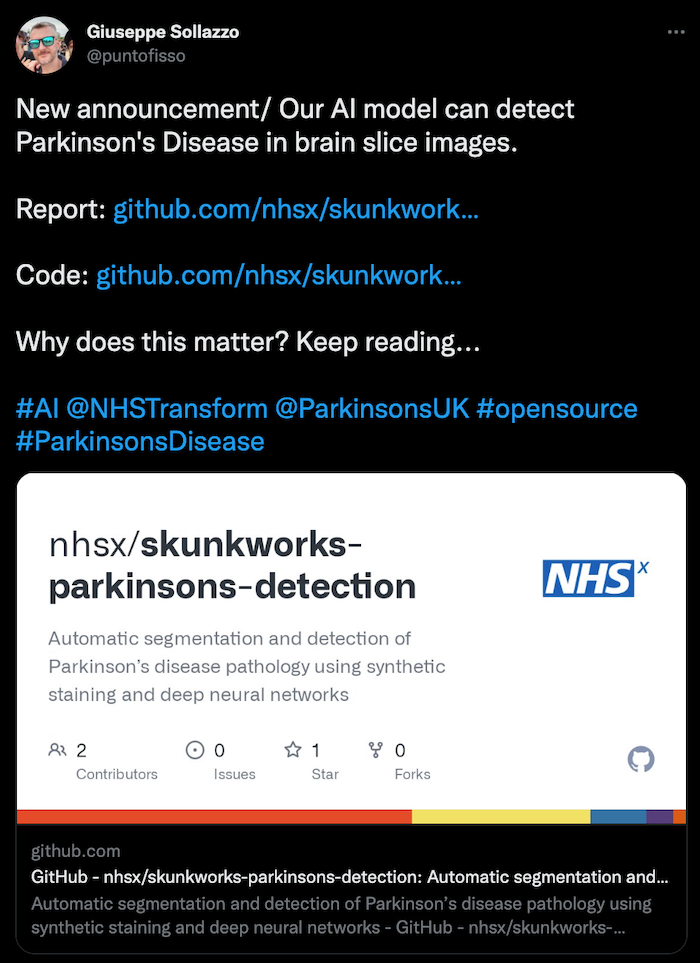
I rarely give big work-related announcements on here, but this one is something I'm really proud of and that is data-related in many ways. My team was part of a collaboration that developed an AI model that is able to detect the presence or absence of Parkinson's Disease in images of brain slides. Although this might sound a bit grim and far away from applicability, there are some good reasons why it's an important and rather exciting step. More in this Twitter thread (with links to a technical report and open source code), and keep an eye on our public show & tell.
The most clicked link last week was the EDJNet data repository about broadband speeds. 231 clicks in total is A LOT. I bet you're all trying to create data visualizations, aren't you? ;-) Let me know if you produce anything, and I'll add to the link list.
I will be away next week, so there will be no newsletter on the 13th. I hope you can resist a week without Quantum. Back with a likely double-whammy the week after next.
Giuseppe @puntofisso
|
Become a Friend of Quantum of Sollazzo → If you enjoy this newsletter, you can support it by becoming a GitHub Sponsor. Or you can Buy Me a Coffee. I'll send you an Open Data Rottweiler sticker. You're receiving this email because you subscribed to Quantum of Sollazzo, a weekly newsletter covering all things data, written by Giuseppe Sollazzo (@puntofisso). If you have a product or service to promote and want to support this newsletter, you can sponsor an issue. |
Topical
This year’s A-level results in England explained in five charts
"It’s been a rollercoaster few years for English A-level students", says the Guardian in this dazzling example of understatement :) Good charts.

Movemap
Where you could move, within the US, controlling for a number of variables including demographics, taxation rates, and environmental hazards.

How Fixes to the $800 Billion Covid Relief Program Got Money to More Small Businesses
"Policy changes to the Paycheck Protection Program, one of the largest in US history, redirected loans to the neediest communities. An analysis of 2020 and 2021 lending data shows what happened."

How attainable is the Singapore dream?
"An investigation into public housing" by Kontinentalist.

Houston keeps paving over rain-absorbent Katy prairie, even after devastating Harvey impacts
"While Harris County officials say the new development is not happening in the floodplain — since it is built atop mounds of fill — and will not increase flood risk downstream because of drainage requirements, such as detention ponds, the fact remains that development covers the prairie sponge with concrete."

The wins, losses and comebacks that made up Serena Williams’s career
"Williams’s career has featured ascents and declines in the WTA rankings and has been filled with the highest professional highs and gutting lows. She battled injuries. She became a mother. She dealt with incidents on and off the court. But she always came back."
What a legend!


Check out Malthus
Malthus helps you connect with new prospects and leads for your business or agency needs to help drive sales and growth. View thousands of handpicked companies that just raised millions and are likely to outsource and engage in B2B sales..
Tools & Tutorials
Visual Sum of Cubes
"This article discusses a pattern I noticed in ‘visual’ derivations of the formulas" for the first n integers and their squres.

An astronomer's introduction to NumPyro
"The source for this post can be found here. Please open an issue or pull request on that repository if you have questions, comments, or suggestions.
This post is implemented as a Jupyter notebook; launch an executable version of this post on MyBinder.org."

DB Fiddle
An online tool to play with databases.
(via Tools for Journalists)

Soccermatics
"This course is the most comprehensive education available on how to work with football data. We will learn how to understand the game using mathematics, statistics and machine learning."
GTFS-GO
"QGIS-Plugin to parse GTFS data, to show and aggregate routes and stops."
There are a good few examples by Thomas Forth here

Introduction to Probability for Data Science
An undergraduate textbook, available for purchase but also as a free electronic download.
Dataviz, Data Analysis, & Interactive
Population by latitude and its variations
An Observable notebook and useful commentary by the Washington Post's How To Read This Chart, with alternative ways to display the same concept and why.

Why 12 notes?
A jupyter notebook-led explanation of Western music.

Until the elections on 11th September...
"...I'll share one question about Sweden each day - to fight misconceptions with relevant facts."
Journalist Karthik Muthuswamy gives daily dataviz a political twist. All content is also published on his website.

Polar Climate Change Figure
With some near real-time visualizations. By NOAA climate scientist Zack Labe.

AI
Principles for the security of machine learning
The National Cyber Security Centre has issued some guidance on the secure use of ML.
quantum of sollazzo is supported by ProofRed's excellent proofreading. If you need high-quality copy editing or proofreading, head to http://proofred.co.uk. Oh, they also make really good explainer videos.

Sponsors* casperdcl and iterative.ai Jeff Wilson Fay Simcock Naomi Penfold
[*] this is for all $5+/months Github sponsors. If you are one of those and don't appear here, please e-mail me