How to pick the least wrong colors: An algorithm for creating color palettes for data visualization
Hi there, Matt here,
Have you heard the term “nerd sniping”? The phrase comes from this XKCD comic. It describes a question that can stop a person in their tracks, tricking them into obsessively searching for the answer.

I recently got nerd sniped. The question was: how can I pick the best colors for data visualization? It’s deceptively simple; as I pulled at the thread, I discovered layers and layers of complexity, weaving together physics, philosophy, and math. The following essay is the result of my journey.
I’ve probably put more effort into this essay than any other I’ve written. I hope you enjoy it. If you have questions, corrections, or ideas, send ‘em my way!
Here’s some music, too: Utaka No Hibi, a 1983 record from Japanese group Mariah. It’s a somewhere between new wave, early punk, and art rock, with lots of catchy vamps blending diverse percussion, ’80s synths, and middle eastern motifs. Credit for this find goes to Logan – thanks Logan!
Now, on to the essay. I’ll include a short excerpt, but this one’s pretty long, so feel free to jump right over to my website to read it.
How to pick the least wrong colors
I’m a self-taught designer.1 This has its upsides: I learn at my own pace (in my case, slowly over decades and counting), I design my own curriculum, and I don’t have to do any homework or pass any tests. But it also has a serious downside: because I don’t have to learn anything, I skip the things that intimidate me. That’s why, for years and years, I’ve avoided learning much of anything about color.
But recently I picked up a pet project that forced me to fill in the gaps in my own knowledge. In the course of trying to solve a seemingly simple problem, I got a crash course in the fundamentals of color. It was (sorry, I have to get this out of my system) eye-opening.
I thought it might be worthwhile to recap my journey so far, not just to share an interesting result to a common challenge in data visualization, but also to help any other learners who have been shy about color.
The problem
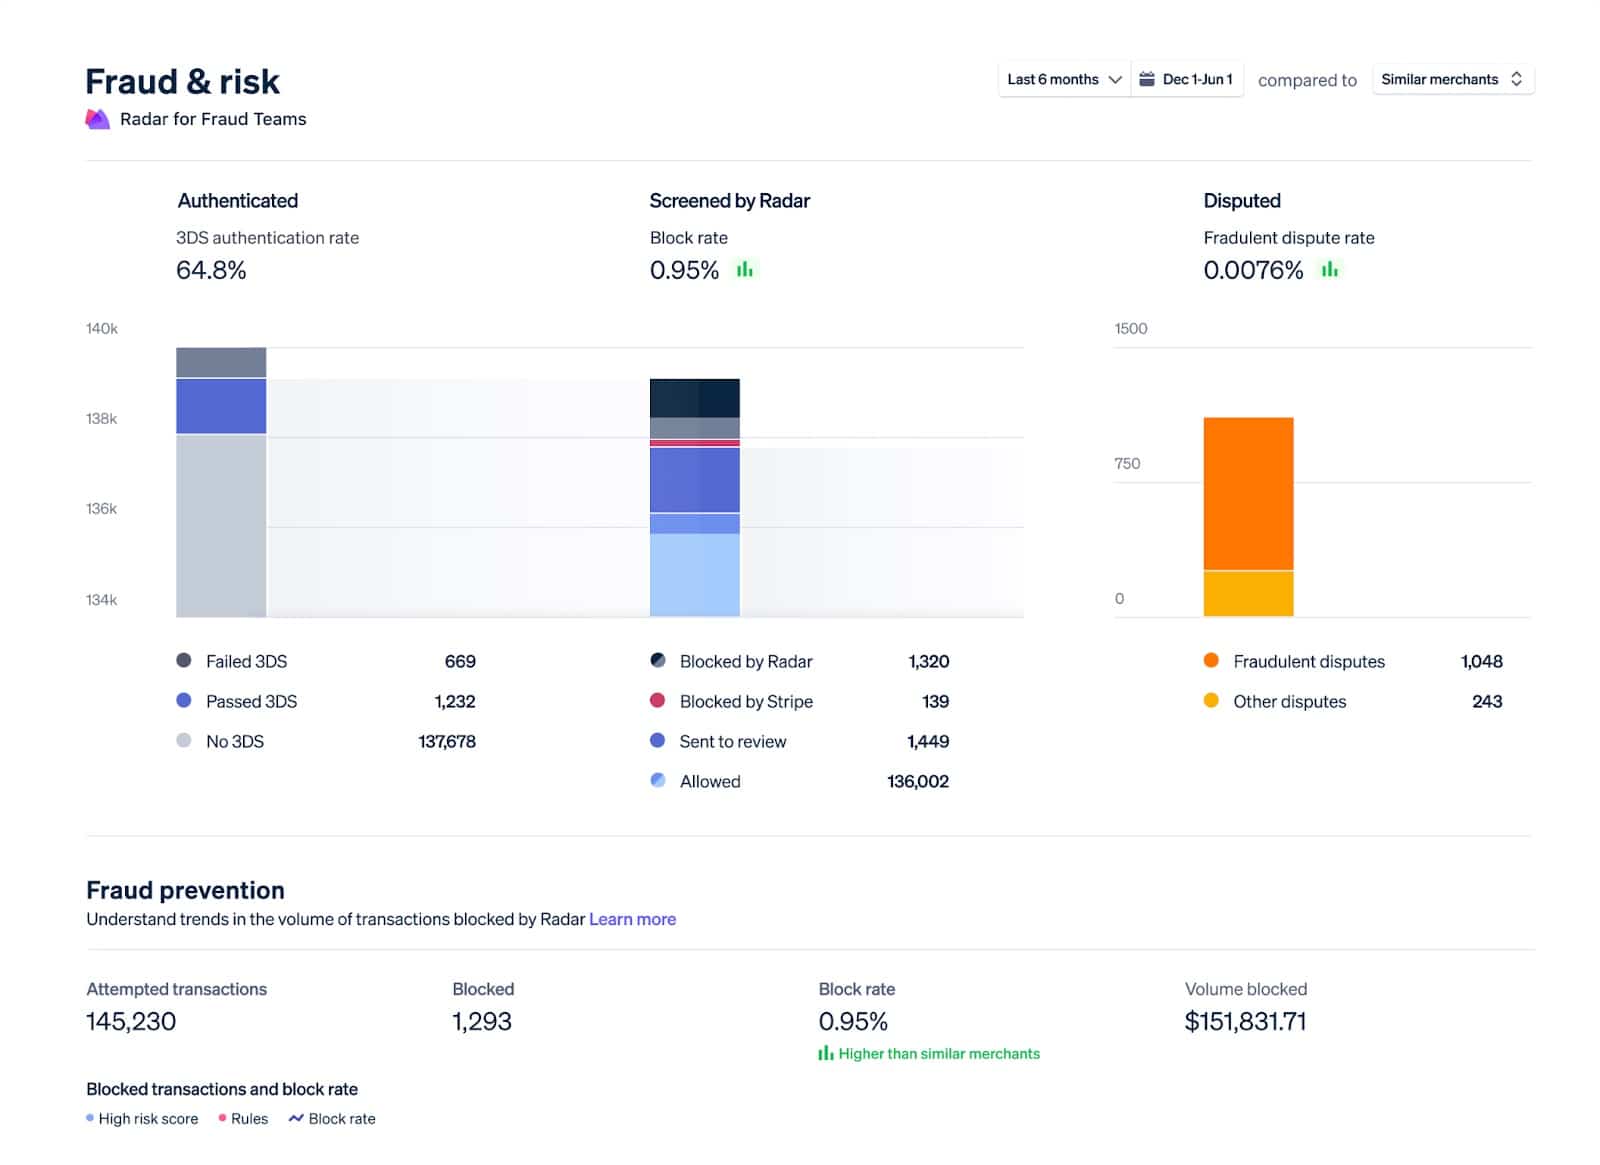
Stripe’s dashboards use graphs to visualize data. While the color palettes we use are certainly passable, the team is always trying to improve them. A colleague was working on creating updated color palettes, and we discussed the challenges he was working through. The problem boiled down to this: how do I pick nice-looking colors that cover a broad set of use cases for categorical data while meeting accessibility goals?
The domain of this problem is categorical data — data that can be compared by grouping it into two or more sets. In Stripe’s case, we’re often comparing payments from different sources, comparing the volume of payments between multiple time periods, or breaking down revenue by product.
The criteria for success are threefold:
- The colors should look nice. In my case, they need to be similar to Stripe’s brand colors.
- The colors should cover a broad set of use cases. In short, I need lots of colors in case I have lots of categories.
- The colors should meet accessibility goals. WCAG 2.2 dictates that non-text elements like chart bars or lines should have a color contrast ratio of at least 3:1 with adjacent colors.
Put this way, the problem doesn’t seem so daunting. Surely, I thought, a smart person has already solved these problems.
Prior art
There are, in fact, many ways to pick good colors for data visualizations. For example:
- Viridis is a sequential palette designed by Stéfan van der Walt and Nathaniel Smith.
- ColorBrewer is a tool and set of color palettes created by Cynthia Brewer.
- Colorgorical is a tool for selecting visually distinct colors created by Connor Gramazio with advisement from David Laidlaw and Karen Schloss.
- Companies like Adobe and IBM have documented the color palettes they use in their design systems for data visualization.
Why none of these solutions work for me
While most of the above palettes would serve as a good starting point, each has tradeoffs as an out-of-the-box solution. Using the ColorBrewer schemes sacrifices accessibility and applicability; using any of them fails to get to the harmony I want with Stripe’s brand colors.
There are many, many other approaches and palettes to try. As I looked through the research and material, I had a sinking feeling that I’d need to settle for something that wasn’t optimal.
That conclusion turned out to be a breakthrough.
Continue reading →
-
A misleading term. Lots of people taught me — but very few of them were professional teachers. ↩